Updated on September 5, 2025
This comprehensive poker charts resource covers everything from poker hand rankings to poker ranges, bankroll management, and pot odds.
When starting to get into poker and the inner workings of the game, discovering what works and the most profitable hands to play should be your first step.
By learning to master poker strategy with these 20 essential charts, which cover poker hand rankings, you’ll set yourself on a path to success!
Let's delve into this comprehensive poker hand guide and chart collection, your one-stop shop to elevate your game!
1. Poker Hands Chart: Hand Rankings
Hand rankings are where it all begins in poker—knowing what beats what is crucial when playing the game.
This essential poker hands chart shows complete hand rankings from best to worst:
| Hand | Example |
|---|---|
| Royal Flush | A♠️K♠️Q♠️J♠️T♠️ (same suit) |
| Straight Flush | 8♦️7♦️6♦️5♦️4♦️ (same suit) |
| 4-of-a-Kind | A-4-4-4-4 |
| Full House | A-A-A-J-J |
| Flush | A♥️J♥️8♥️4♥️2♥️ (same suit) |
| Straight | 8-7-6-5-4 (various suits) |
| 3-of-a-Kind | A-K-5-5-5 |
| Two Pair | A-A-J-J-2 |
| One Pair | A-A-7-4-2 |
| High Card | A-Q-9-6-3 (various suits) |
Download this poker hand rankings table in PDF format.
2. Poker Starting Hands Chart: Top 10 Texas Hold'em Hands
However, simply knowing where the made hands rank is just the beginning. You also need to know which starting hands are best to play and will win more in the long run.
This poker starting hands chart ranks the most profitable hands by expected value:
| Rank | Hand | Abbreviation |
|---|---|---|
| 1 | Pocket Aces | AA |
| 2 | Pocket Kings | KK |
| 3 | Pocket Queens | |
| 4 | Ace-King Suited | AKs |
| 5 | Pocket Jacks | JJ |
| 6 | Pocket Tens | TT |
| 7 | Ace-King Off-suit | AKo |
| 8 | Ace-Queen Suited | AQs |
| 9 | Ace-Jack Suited | AJs |
| 10 | King-Queen Suited | KQs |
Check out the full Texas Holdem Starting Hands Charts article.
3. Poker Hand Guide: Common Starting Hand Nicknames
Poker players are always creating monikers for all sorts of poker references. The fact is no more accurate than for poker hands.
Players worldwide use a variety of popular poker hand nicknames, and this poker hand guide covers essential terminology:
| Hand | Nickname | Hand | Nickname |
|---|---|---|---|
| AA | Bullets/Rockets | AKs | Big Slick |
| KK | Cowboys | AJ | Blackjack |
| Ladies | K9 | Canine | |
| JJ | Fishhooks | T2 | Doyle Brunson |
| 88 | Snowmen | Q7o | Computer Hand |
| 77 | Walking Sticks | 44 | Sail Boats |
| 33 | Crabs | 22 | Ducks |
4. Common Made Hand Nicknames
Once you’ve made your hand, we have nicknames for a few as itemised below:
| Hand | Nickname |
|---|---|
| A-K-Q-J-T straight | Broadway |
| A-2-3-4-5 straight | Wheel |
| A-2-3-4-5 straight flush | Steel Wheel |
| K-K-K-K-X | Four Horsemen |
| 2-2-2-2-X | Mighty Ducks |
See the complete Poker Hand Nicknames list.
5. Poker Blinds Chart: Table Stakes
Here are blind levels and their corresponding stake names. (Stake name represents $ amount for 100bb.)
This poker blinds chart is essential for understanding table dynamics:
| Blinds | Stake | Notes |
|---|---|---|
| $0.01/$0.02 | 2NL | Lowest online (select sites) |
| $0.05/$0.10 | 10NL | Lowest online (most sites) |
| $0.25/$0.50 | 50NL | Micro stakes ceiling |
| $0.50/$1.00 | 100NL | Lowest live (select locations) |
| $1/$2 | 200NL | Lowest live (most locations) |
| $2/$5 | 500NL | |
| $5/10 | 1000NL | High stakes online |
| $25/$50 | 5000NL | High stakes live |
Access the full Poker Blinds Charts article.
6. Player Position Abbreviations
Knowing where you’re seated, especially in relation to the rest of the players at the table, is critical.
However, familiarising yourself with the table abbreviations can mean the difference between calling, folding or raising a hand.
| 10-max Position | 6-max Position | Full Name | |
|---|---|---|---|
| 10-max | 6-max | ||
| UTG/EP1 | - | Under The Gun | - |
| UTG+1/EP2 | - | Under The Gun +1 | - |
| UTG+2/EP3 | - | Under The Gun +2 | - |
| MP1 | - | Middle Position 1 | - |
| LJ/MP2 | UTG | Lojack | Under the Gun |
| HJ/MP3 | HJ | Hijack | Hijack |
| CO | CO | Cutoff | Cutoff |
| BTN | BTN | Button | Button |
| SB | SB | Small Blind | Small Blind |
| BB | BB | Big Blind | Big Blind |
Dive deeper into the full poker position charts article.
7. Poker Ranges Chart: 6-Max Cash Hand Ranges (100bb)
This GTO poker ranges chart shows optimal opening ranges by position for 6-max cash games:
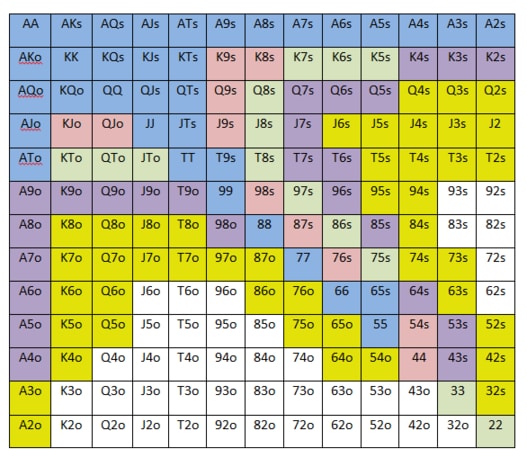
Explore the full 6 Max Opening Ranges and Hand Selection Charts article.
Poker Hand Chart: 9-Max Cash Opening Ranges (100bb)
There are significant differences in which hands you should play from which positions, depending on the number of players at the table.
Recommended poker starting hands ranges for full-ring cash games:
| Position | % Hands | Range |
|---|---|---|
| UTG | 10% | 77+, ATs+, KTs+, QTs+, J9s+, T9s, 98s, A5s, AQo+ |
| UTG+1 | 10% | 77+, ATs+, KTs+, QTs+, J9s+, T9s, 98s, A5s, AQo+ |
| UTG+2 | 13% | 77+, A8s+, K9s+, Q9s+, J9s+, T9s, 98s, A4s-A5s, AJo+ |
| LJ | 16% | 55+, A2s+ K9s+, Q9s+ J9s+ T8s+, 98s, 87s, 76s, AJo+, KQo |
| HJ | 20% | 44+, A2s+, K8s+, Q9s+ J9s+ T8s+, 97s+, 87s, 76s, 65s, 54s, ATo+, KJo+, QJo |
| CO | 26% | 22+, A2s+, K5s+, Q8s+ J8s+ T8s+, 97s+, 86s+, 75s+, 65s, 54s, ATo+, KTo+, QTo+, JTo |
| BTN | 40% | 22+, A2s+, K2s+, Q5s+ J7s+ T6s+, 96s+, 85s+, 75s+, 64s+, 53s+, 43s, A4o+, K9o+, Q9o+, J9o+, T9o, 98o |
| SB | 47%+ | 22+, A2s+, K2s+, Q4s+ J6s+ T6s+, 95s+, 84s+, 74s+, 63s+, 53s+, 43s, A2o+, K8o+, Q8o+, J8o+, T8o+, 98o |
9. Poker Chart: Pot Odds and Betting Strategy
Knowing when to bet and how much is another crucial part of poker strategy.
This poker chart covers pot odds calculations and optimal betting frequencies:
| Bet Size | Bettor Must Win | Caller Must Win | Calling Odds | Value Bet % | Bluff % |
|---|---|---|---|---|---|
| 25% (¼-pot) | 20% | 17% | 5:1 | 83% | 17% |
| 33% (⅓-pot) | 25% | 20% | 4:1 | 80% | 20% |
| 50% (½-pot) | 33% | 25% | 3:1 | 75% | 25% |
| 66% (2/3-pot) | 40% | 28% | 2.6:1 | 72% | 28% |
| 75% (¾-pot) | 43% | 30% | 2.3:1 | 70% | 30% |
| 100% (pot) | 50% | 33% | 2:1 | 67% | 33% |
| 150% (1.5x-pot) | 60% | 38% | 1.7:1 | 62% | 38% |
| 200% (2x-pot) | 66% | 40% | 1.5:1 | 60% | 40% |
Formula: Bet Size / (Initial Pot + (2 x Bet Size)) OR Bet Size / (New Pot Size + Bet Size)
Learn more in our full poker pot odds charts article.
10. Outs and Equities Chart
Knowing your improvement percentages in common drawing situations will help you make profitable decisions when chasing that flush or straight draw.
These poker charts will help you calculate outs more easily:
| Outs | Example | Percent Chance of Improving | ||
|---|---|---|---|---|
| Turn or River | Turn Only | River Only | ||
| 1 | 4.26% | 2.13% | 2.17% | |
| 2 | Pocket Pair to Set | 8.42% | 4.26% | 4.35% |
| 3 | One Overcard to One Pair | 12.49% | 6.38% | 6.52% |
| 4 | Gutshot | 16.47% | 8.51% | 8.70% |
| 5 | One Pair to Two Pair or Set | 20.3% | 10.64% | 10.87% |
| 6 | No Pair to Pair (Hold’em) | 24.14% | 12.77% | 13.04% |
| 7 | Set to Full-House/Quads | 27.84% | 14.89% | 15.22% |
| 8 | Open-Ended (OESD) | 31.45% | 17.02% | 17.39% |
| 9 | Flush Draw (FD) | 34.97% | 19.15% | 19.57% |
| 10 | Gutshot + 2 overs | 38..39% | 21.28% | 21.74% |
| 12 | Gutshot + FD | 44.96% | 25.53% | 26.09% |
| 15 | OESD + FD | 54.12% | 31.91% | 32.61% |
The formula is simple:
- If you’re on the flop and want to know the rough % chance of improving by the river, multiply your outs by 4.
- If you want to know the % chance of improving on the next street only (flop to turn or turn to river), multiply your outs by 2.
11. Common Preflop Equity Matchups
Here are the head-to-head preflop equity percentages for several typical scenarios.
These poker range matchups are fundamental for decision-making:
| Hand 1 | Equity | vs Hand 2 | Equity |
|---|---|---|---|
| Overpair (AA) | 81% | Underpair (KK) | 19% |
| Overpair (AA) | 92% | Dominated hand (AK) | 8% |
| 2 overcards (AK) | 62% | 2 undercards (87) | 38% |
| 2 overcards (AK) | 46% | Lower pair (88) | 54% |
| 1 overcard (A5) | 56% | 2 middle cards (87) | 44% |
| 1 overcard (A5) | 31% | Lower pair (88) | 69% |
| Dominating higher card (AK) | 73% | Dominated higher card (AJ) | 27% |
12. Common Postflop Equity Scenarios
Postflop scenarios differ significantly from preflop situations. In these instances, knowing your percentages versus one opponent is crucial.
| Hand 1 | Hand 2 | Flop Example | Flop % | Turn Example | Turn % |
|---|---|---|---|---|---|
| Top Pair | Dominated TP | AK v A5 on AT7 | 88% v 12% | AK v A5 on AT72 | 92% v 8% |
| Two Pair: 2nd & 3rd | Top Pair + Overcard | 87 v AT on T87 | 72% v 28% | 87 v AT on T872 | 82% v 18% |
| Flush Draw | Top Pair | 8s7s v AK on Ks5s2x | 37% v 63% | 87s v AK on Ks5s2x3x | 20% v 80% |
| Flush Draw | Set | As2s v 66 on Js6s5x | 26% v 74% | As2s v 66 on Js6s5xTx | 16% v 84% |
| OESD | Set | 87 v 66 on 962 | 26% v 74% | 87 v 66 on 9623 | 19% v 81% |
Master these concepts with our poker equity charts guide.
13. Minimum Defence Frequency (MDF)
Minimum Defence Frequency (MDF) is a mathematical concept used to determine the optimal hand range for defence.
This chart helps you determine the frequency at which you need to continue making Villain's zero equity hands indifferent to calling.
Formula: Initial Pot / (Initial Pot + New Bet)
| Bet Size | MDF |
|---|---|
| 25% (¼-pot) | 80% |
| 33% (⅓-pot) | 75% |
| 50% (½-pot) | 67% |
| 66% (⅔-pot) | 60% |
| 75% (¾-pot) | 57% |
| 100% (pot) | 50% |
| 150% (1.5x pot) | 40% |
| 200% (2x pot) | 33% |
NOTE: Over-folding slightly on the flop is acceptable when at a range disadvantage.
Check out our practical guide for using MDF in poker.
14. Preflop Raise Sizing Guidelines
Vs Limpers (Formula: Pot + 1bb OOP, +1bb per additional limper). The suggestion is to add 1bb for each additional limper.
Limper Sizing Chart
| IP vs Limp | SB vs Limp | BB vs IP Limp | BB vs SB Limp |
|---|---|---|---|
| 4.5bb | 5.0bb | 4.5bb | 3.0bb |
3bet Sizing vs PFR (Pot-sized)
| Original Raise | IP 3bet | SB 3bet | BB 3bet |
|---|---|---|---|
| 2bb | 7.5bb | 8.0bb | 7.5bb |
| 2.25bb | 8.25bb | 8.75bb | 8.25bb |
| 2.5bb | 9.0bb | 9.5bb | 9.0bb |
| 3bb | 10.5bb | 11.0bb | 10.5bb |
| 3.5bb | 12bb | 12.5bb | 12bb |
BB vs SB uses 3x the raise size formula (ex., if raise 2bb -> 3bet 6bb). You may raise larger when deeper.
More details available in the comprehensive bet sizing guide.
15. Bankroll Management by Win Rate
The best poker players of all time rely on solid bankroll management strategy. Your BRM guidelines should be dependent on your win rate for the game that you're playing.
Recommended bankrolls for 3% risk of ruin:
| Win Rate | Required BBs | Buy-ins | $1/$2 | $2/$5 | $5/$10 |
|---|---|---|---|---|---|
| 3bb/100 | 10,000 | 100 | $20,000 | $50,000 | $100,000 |
| 5bb/100 | 8,000 | 80 | $16,000 | $40,000 | $80,000 |
| 7bb/100 | 6,000 | 60 | $12,000 | $30,000 | $60,000 |
| 10bb/100 | 4,000 | 40 | $8,000 | $20,000 | $40,000 |
| 20bb/100 | 2,500 | 25 | $5,000 | $12,500 | $25,000 |
16. Cash Game Bankroll Requirements
Conservative vs aggressive bankroll management approaches. Every poker chart collection should include proper bankroll guidelines:
| Stakes | Min Buy-in | Max Buy-in | Safe (100 BI) | Aggressive (20 BI) |
|---|---|---|---|---|
| 2NL | $0.40 | $2.00 | $200 | $40 |
| 5NL | $1.00 | $5.00 | $500 | $100 |
| 10NL | $2.00 | $10.00 | $1000 | $200 |
| 25NL | $5.00 | $25.00 | $2500 | $500 |
| 100NL | $20.00 | $100.00 | $10,000 | $2000 |
| 200NL | $40.00 | $200.00 | $20,000 | $4000 |
Ultra-aggressive: Take shots at 14 BI, drop down at 10 BI
For full details, refer to the poker bankroll management charts article.
17. Tournament Bankroll Requirements
For tournament players, the formula is slightly different and relies on a 30% ROI assumption:
| Tournament Size | Required Buy-ins |
|---|---|
| 9 players | 24 |
| 45 players | 69 |
| 90 players | 103 |
| 245 players | 154 |
| 550 players | 219 |
| 1,200 players | 289 |
| 2,600 players | 375 |
Tournament Bankroll Tip: Seek tournaments with
18. Full-Limit Hold'em Buy-in Chart
Limit Hold’em has a different interpretation of stakes, which refers to the small and big bet. The small and big blinds are typically 50% of the stakes.
| Limit | Small Blind | Big Blind | Min Buy-in |
|---|---|---|---|
| $0.02/$0.04 | $0.01 | $0.02 | $0.20 |
| $0.05/$0.10 | $0.02 | $0.05 | $0.50 |
| $0.25/$0.50 | $0.10 | $0.25 | $2.50 |
| $1/$2 | $0.50 | $1 | $10 |
| $2/$4 | $1 | $2 | $20 |
| $5/$10 | $2 | $5 | $100 |
| $10/$20 | $5 | $10 | $200 |
| $20/$40 | $10 | $20 | $400 |
| $40/$80 | $20 | $40 | $800 |
Note: Stakes refer to small bet/big bet sizes, not blinds
19. Online Poker Tournament Structure Strategy Chart
Different types of poker games require tournament formats with distinct strategic approaches.
This poker chart shows how to adjust your strategy based on tournament structure and stage:
| Format | Blind Structure | Key Strategy | Early Stage | Middle Stage | Late Stage | Bubble/ITM |
|---|---|---|---|---|---|---|
| Regular MTT | 10-15 min levels | Build stack steadily | Tight-aggressive, 15-18% VPIP | More aggressive, 18-22% VPIP | Push/fold dominant | ICM considerations |
| Turbo | 5-8 min levels | Faster aggression | Skip early tight phase | Quick accumulation phase | Earlier push/fold mode | Survival priority w/ ICM in mind |
| Hyper-Turbo | 2-3 min levels | Immediate aggression | Push/fold from start | No real middle stage | Short stack all-in fest | Push-fold strategy locked in. Ultra high variance |
| Deep Stack | 20+ min levels | Patient build-up | Very tight, premium hands | Slow build, implied odds | Extended skill edge | Deep stack play longer (ICM considerations) |
Knockout/ Bounty | Standard levels | Attack shorter stacks | Tight-aggressive, 15-18% VPIP | Bounty > ICM decisions | Hunt bounties aggressively if big stacked | Less bubble pressure |
| Satellite | Varies | Survival focused | Moderate aggression | Tight near qualification | Extreme survival mode | All-or-nothing spots |
Note: Adjust based on stack sizes.
20. Push/Fold Chart: Nash Equilibrium
Nash equilibrium poker hand guide for heads-up push/fold decisions and SB open-shove ranges:
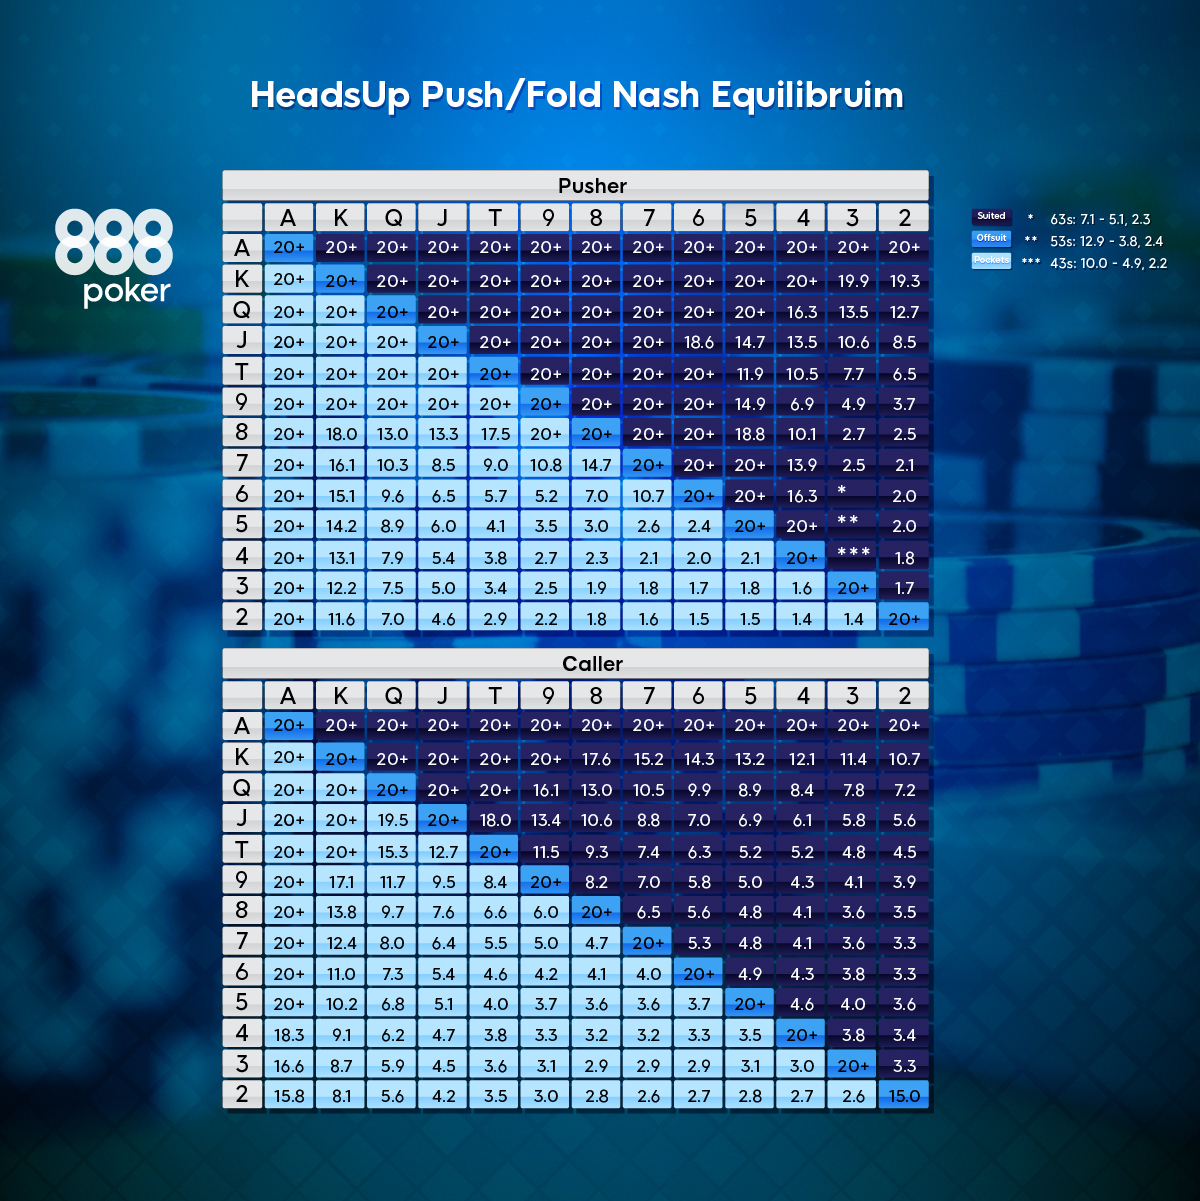
For Button pushing: divide numbers by 2. For CO pushing: divide by 4.
Check out the full Push/Fold charts article.
